
Relatórios para Clientes com Dados de Tempo
Relatórios transparentes de tempo reduzem disputas de faturas, justificam suas tarifas e facilitam renovações. Veja como criar relatórios que clientes valorizam.
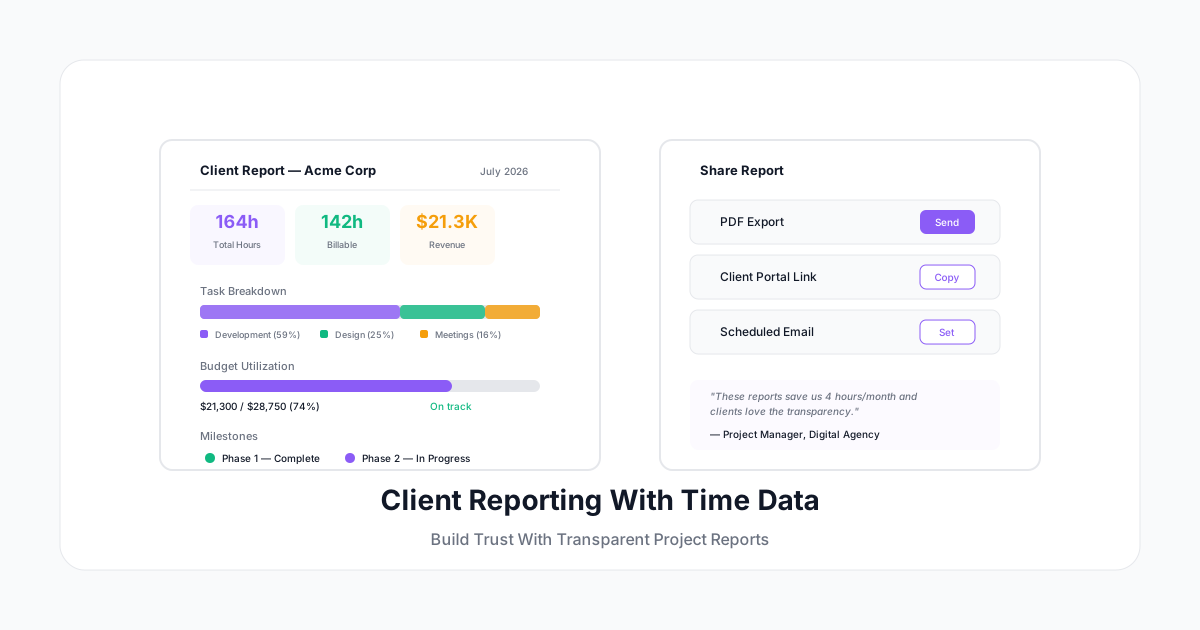
Seus clientes querem saber para onde vai o dinheiro deles. Eles não querem acreditar na sua palavra — querem ver. Relatórios transparentes baseados em tempo constroem confiança, reduzem disputas de faturas, justificam suas taxas e facilitam renovações.
Ainda assim, a maioria das agências e consultorias envia faturas com uma única linha: "Serviços profissionais — R$70.000." Sem detalhamento. Sem contexto. Sem visibilidade. Clientes pagam, mas não estão confiantes de que estão obtendo valor. E quando cortes de orçamento chegam, essas faturas opacas são as primeiras a ir.
Veja como usar seus dados de controle de horas para criar relatórios de clientes que fortalecem relacionamentos, reduzem atrito no pagamento e posicionam seu trabalho como investimento em vez de despesa.
Por Que Relatórios para Clientes Importam
Efeito Composto da Confiança
Cada relatório transparente constrói confiança. Cada fatura opaca a corrói. Ao longo de 12 meses:
- Faturamento transparente → cliente recomenda você para colegas
- Faturamento opaco → cliente busca 3 propostas concorrentes na renovação
A agência que mostra seu trabalho mantém clientes por mais tempo. Dados do setor mostram que faturamento transparente reduz churn de clientes em 20-35%.
Menos Disputas de Faturas
Disputas de faturas geralmente vêm da incerteza: "Pelo que estamos pagando?" Quando clientes podem ver exatamente como as horas foram gastas, disputas caem dramaticamente. A maioria das agências que implementa relatórios detalhados vê disputas de faturas diminuírem em 60-80%.
Proteção de Escopo
Quando um cliente pede "só mais uma coisinha," seu relatório de tempo do mês passado mostra as 12 "coisinhas" que adicionaram 20 horas. Os dados tornam a conversa sobre escopo factual — não confrontacional.
Alavancagem na Renovação
Na hora da renovação, um ano de relatórios mostrando entrega consistente de valor é sua melhor ferramenta de vendas. "Aqui estão 12 meses de dados mostrando que entregamos X horas em Y entregas, tudo dentro do orçamento."
O Que Incluir nos Relatórios de Clientes
As Seções Essenciais
1. Resumo Executivo (2-3 frases)
O que foi realizado neste período? Destaque as entregas principais, não cada item.
"Em julho, completamos o redesign do dashboard de usuários, lançamos a série de campanhas de email e iniciamos a Fase 2 de desenvolvimento. Investimento total: 142 horas faturáveis dentro do orçamento mensal de 150 horas."
2. Detalhamento de Horas por Categoria
Mostre para onde o tempo foi no nível de categoria:
| Categoria | Horas | % do Total |
|---|---|---|
| Design | 38h | 27% |
| Desenvolvimento | 72h | 51% |
| Estratégia/Planejamento | 18h | 13% |
| Gestão de Projeto | 14h | 9% |
| Total | 142h | 100% |
3. Status do Orçamento
Acompanhamento claro e visual do orçamento:
- Orçamento mensal: 150 horas
- Usado este mês: 142 horas (95%)
- Restante: 8 horas
- Acumulado no ano: 862 / 900 horas (96%)
- Status: No caminho certo
4. Entregas Concluídas
Conecte horas a resultados:
- ✅ Redesign do dashboard de usuários (38h design + 45h dev)
- ✅ Série de campanhas de email — 6 templates (18h design + 12h copy)
- 🔄 Desenvolvimento Fase 2 — em andamento (27h de 80h estimadas)
5. Prévia do Próximo Período
O que está planejado para o próximo mês:
- Concluir desenvolvimento da Fase 2
- Iniciar testes com usuários (estimativa 20h)
- Revisão mensal de analytics e otimização
Seções Opcionais (Mas Impressionantes)
Alocação da Equipe
Mostre quais membros da equipe trabalharam na conta (especialmente se o cliente paga por taxas de sênior vs júnior):
- Desenvolvedor Sênior (Sarah): 40h
- Desenvolvedor Pleno (James): 32h
- Designer Sênior (Alex): 38h
- Gerente de Projeto (Kim): 14h
- Estrategista (Pat): 18h
Métricas de Eficiência
- Tarefas concluídas por hora
- Tempo médio de entrega por tipo de entregável
- Taxa de aprovação na primeira vez
- Proporção de revisões (horas de revisão ÷ horas totais)
Previsão de Orçamento
"No ritmo atual, o orçamento do Q3 será 94% utilizado. Se a Fase 3 for aprovada, projetamos 108% de utilização — recomendamos um aumento de 15 horas no orçamento de setembro."
Formatos de Relatório Que Funcionam
Formato 1: Relatório Mensal em PDF
Melhor para: Clientes que querem um documento polido para seus arquivos/diretoria
- Template limpo com marca
- Gráficos visuais (gráfico de pizza para alocação, gráfico de barras para orçamento)
- Resumo executivo na frente
- Tabelas detalhadas no apêndice
- Enviado em até 5 dias úteis após o fim do mês
Formato 2: Dashboard ao Vivo para o Cliente
Melhor para: Clientes que querem visibilidade em tempo real
- URL de dashboard compartilhado (somente leitura)
- Atualiza em tempo real conforme o tempo é registrado
- Barras de progresso do orçamento
- Filtrável por período, categoria, membro da equipe
- Sem faturas "surpresa" — eles veem sendo construído ao longo do mês
Formato 3: Resumo Anexado à Fatura
Melhor para: Clientes que querem eficiência (um documento para revisar)
- Resumo de 1 página anexado à fatura
- Números-chave: total de horas, status do orçamento, entregas concluídas
- Formato de leitura rápida (bullets, não parágrafos)
- Link para detalhamento completo se quiserem aprofundar
Formato 4: Revisão Trimestral de Negócios
Melhor para: Parcerias estratégicas com clientes maiores
- Revisão abrangente de 3 meses
- Análise de tendências (estamos ficando mais eficientes ao longo do tempo?)
- Estimativa de ROI (quando possível)
- Recomendações para o próximo trimestre
- Apresentado ao vivo (videoconferência ou presencial)
Gerando Relatórios a Partir de Dados de Tempo
Dados Que Você Precisa Capturar
Para relatórios úteis de clientes, seu controle de horas deve registrar:
- Atribuição de cliente/projeto (qual conta)
- Tipo de categoria/atividade (que tipo de trabalho)
- Membro da equipe (quem trabalhou nisso)
- Descrição breve (o que especificamente foi feito)
- Tag de faturável vs não faturável
- Data/hora (quando aconteceu)
Erros Comuns em Relatórios
Erro: Detalhes demais
Mostrar cada entrada de 15 minutos sobrecarrega os clientes. Eles não precisam ver "Resposta de email para pergunta da Karen (0,25h)" — precisam ver "Comunicação com cliente: 4 horas."
Correção: Relate no nível de categoria ou entregável. Mantenha detalhe por item disponível se pedirem, mas não comece com isso.
Erro: Horas sem contexto
"Desenvolvimento: 72 horas" não significa nada sem saber o que foi construído. Sempre ligue horas a entregas.
Correção: "Desenvolvimento: 72 horas — Construção do dashboard de usuários (v2), integração de API e scripts de migração de dados."
Erro: Timing inconsistente
Enviar relatórios às vezes no dia 5, às vezes no dia 15, às vezes nem enviar — destrói confiança.
Correção: Defina uma cadência. Mensal no dia 5. Revisões trimestrais na última semana do trimestre. Sempre no prazo.
Erro: Só reportar quando as coisas estão boas
Se um projeto estoura o orçamento, não esconda. Reporte com transparência: "A Fase 2 exigiu 15 horas adicionais devido à complexidade da API. Aqui está o porquê e aqui está o cronograma ajustado."
Correção: Relatórios consistentes independente se as notícias são boas ou ruins. Confiança se constrói na transparência em momentos difíceis.
Configuração de Automação
Relatórios Baseados em Template
Crie um template de relatório uma vez. Depois, a cada mês:
- Extraia dados de tempo do período (consulta automatizada)
- Popule o template (horas por categoria, status do orçamento, alocação da equipe)
- Adicione comentário manual (resumo executivo, prévia do próximo período)
- Envie
Tempo total: 15-30 minutos por cliente por mês.
Geração Programada de Relatórios
A maioria das ferramentas de controle de horas pode:
- Auto-gerar relatórios de projeto em uma programação
- Enviá-los por email aos contatos do cliente
- Incluir alertas de orçamento se estiver se aproximando do limite
- Manter histórico de relatórios para revisões de fim de ano
Acesso ao Portal do Cliente
A abordagem mais eficiente: dê aos clientes acesso somente leitura a um dashboard mostrando os dados de tempo do projeto. Eles verificam quando quiserem. Você não precisa gerar nada — o sistema é o relatório.
Lidando com Conversas Difíceis
"Por que isso levou tantas horas?"
Framework de resposta:
- Reconheça a pergunta (não fique na defensiva)
- Referencie as entradas de tempo específicas e descrições
- Explique a complexidade (escopo era maior que o esperado, desafio técnico, múltiplas rodadas de revisão)
- Proponha solução (ajustar escopo da próxima vez, abordagem diferente, estimativa atualizada)
Dados de tempo transformam "demorou demais" de opinião em uma discussão factual.
"Vocês podem reduzir horas no próximo mês?"
Framework de resposta:
- Mostre o detalhamento atual de horas por categoria
- Pergunte: "Qual categoria devemos reduzir?"
- Explique o trade-off (menos design = menos opções de revisão; menos PM = comunicação mais lenta)
- Ofereça alternativas (reduzir escopo, mudar para modelo de preço fixo, ajustar expectativas de qualidade)
"Precisamos cortar 20% do orçamento"
Framework de resposta:
- Mostre dados históricos: aqui está o que cada categoria entrega
- Forneça opções: "Com 80% do orçamento, aqui está o que podemos entregar vs postergar"
- Nunca simplesmente absorva o corte sem ajustar escopo (esse caminho leva a excesso de trabalho e ressentimento)
A Vantagem Competitiva
A maioria das agências NÃO envia relatórios detalhados de tempo. As que enviam se destacam imediatamente:
- Clientes se sentem informados em vez de apenas faturados
- Equipes de procurement aprovam renovações mais rápido (têm documentação)
- Solicitações de orçamento são mais fáceis (dados históricos sustentam o pedido)
- Indicações aumentam (clientes recomendam parceiros confiáveis)
Os 20-30 minutos por mês que você gasta em relatórios para clientes se pagam muitas vezes em retenção e indicações.
Como Começar
- Escolha seu formato. PDF mensal é o ponto de partida mais fácil.
- Crie um template. Resumo executivo + detalhamento de horas + status do orçamento + entregas.
- Envie um este mês. Não espere pela perfeição. Comece com "bom o suficiente."
- Peça feedback. "Isso é útil? O que vocês gostariam de ver?"
- Itere. Refine com base no que os clientes realmente valorizam ver.
O A Human Time gera relatórios prontos para clientes automaticamente a partir dos seus dados de tempo rastreado: exportações em PDF com marca, links de dashboards ao vivo e resumos de status de orçamento que tornam sua transparência sem esforço. Porque os melhores relacionamentos com clientes são construídos sobre visibilidade, não apenas confiança.
Mostre seu trabalho. Seus clientes vão agradecer — geralmente ficando mais tempo e indicando mais.